
What Is Page Speed & How to Improve It
By Raju Ahmmed | SEO & AI Search Optimization Specialist.
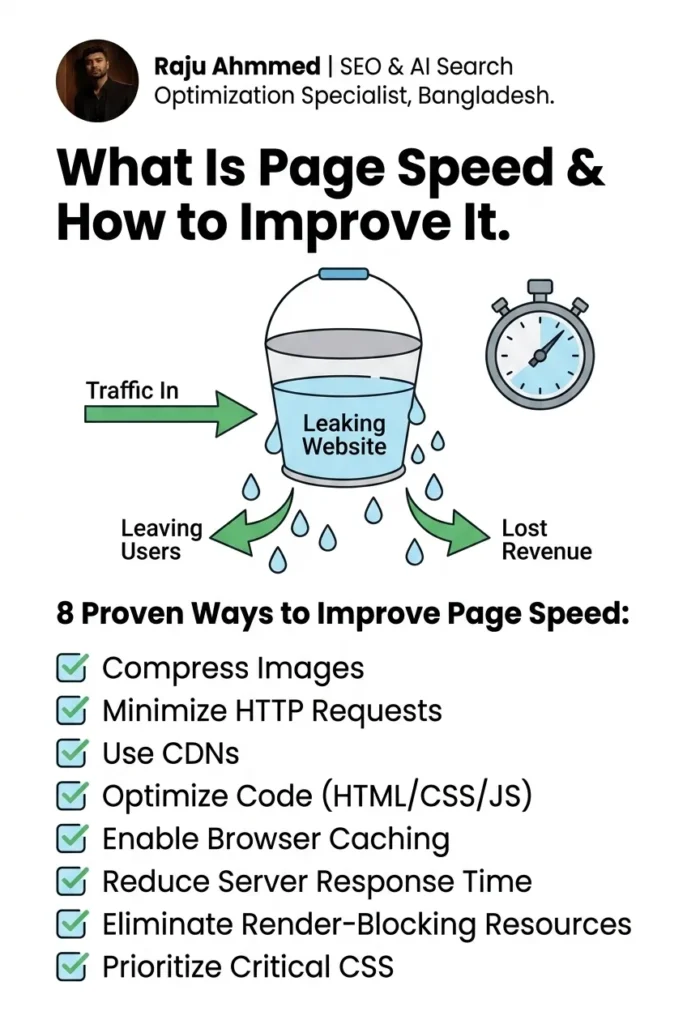
A slow website is a leaking bucket. Traffic comes in — but users leave before they convert, Google lowers your rankings, and revenue quietly drips away. Page speed is one of the most impactful — and most fixable — SEO problems you can solve. This guide shows you exactly what it is, why it matters, how to measure it, and 8 proven ways to improve it.
Claim Your FREE SEO Audit
Before you optimize anything, you need to know where you stand.
I offer a free technical SEO audit for websites in Bangladesh and beyond — covering page speed, Core Web Vitals, crawl issues, on-page health, and more. No fluff, no sales pitch. Just a clear, actionable report.
What Is Page Speed?
Page speed is the time it takes for a webpage to fully load and become usable for a visitor. It is measured in seconds — and even fractions of a second matter.
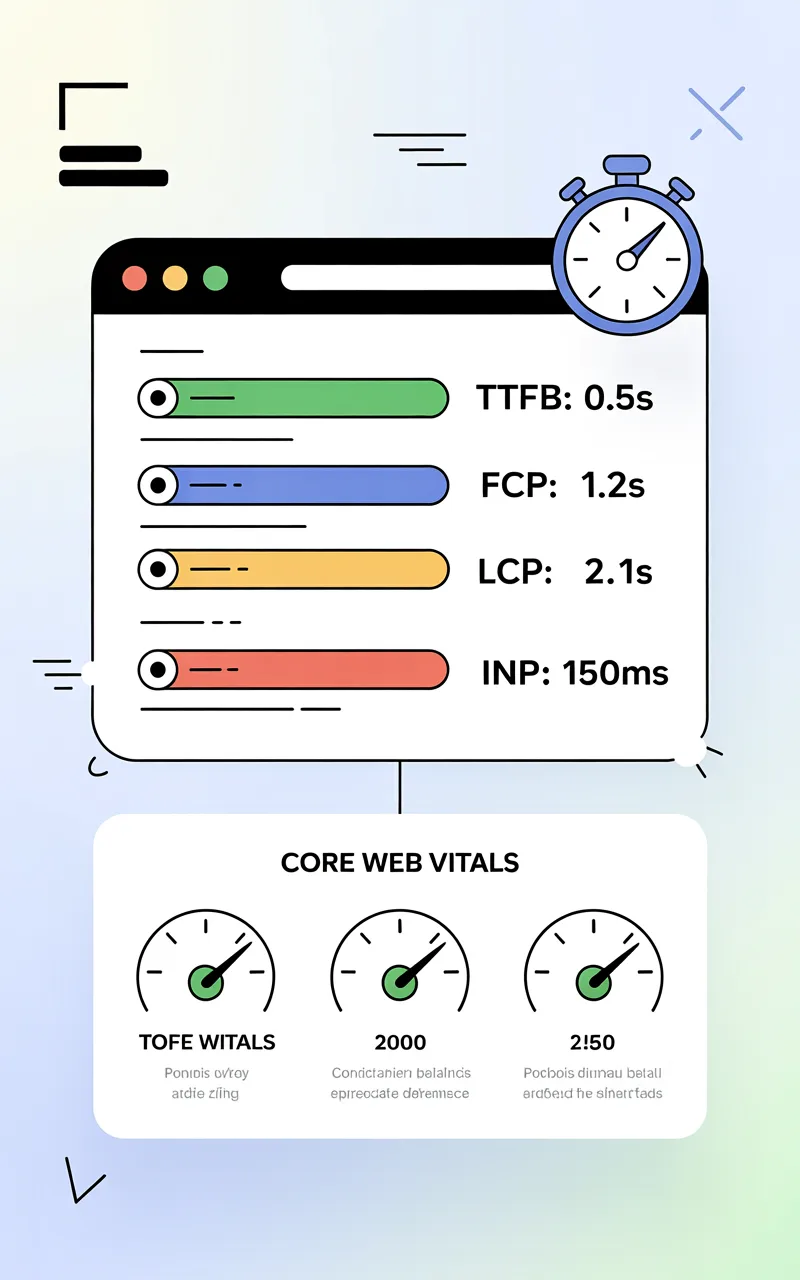
More precisely, page speed refers to a set of metrics that capture different stages of the loading process:
- TTFB (Time to First Byte): How fast your server responds to a browser request. Google recommends under 800ms.
- FCP (First Contentful Paint): When the first piece of content appears on screen.
- LCP (Largest Contentful Paint): When the biggest visible element (hero image, H1) finishes loading. Google’s “Good” threshold is under 2.5 seconds.
- INP (Interaction to Next Paint): How fast the page responds to user clicks and taps. Target: under 200ms.
- CLS (Cumulative Layout Shift): How much page elements shift unexpectedly during load. Target: under 0.1.
LCP, INP, and CLS together form Google’s Core Web Vitals — the official performance metrics used as ranking signals since June 2021.
In simple terms: page speed is how fast your site feels to a real user on a real device.
Why Is Page Speed Important for SEO?
Page speed directly affects your Google rankings, your user experience, and your revenue. It is not optional — it is a confirmed ranking factor.
Google officially added page speed as a ranking signal for desktop in 2010 and mobile in 2018 via the Speed Update. Then in June 2021, Core Web Vitals became a full ranking factor through the Page Experience update. That means Google is now actively evaluating and rewarding fast websites — and penalizing slow ones.
The data tells a clear story:
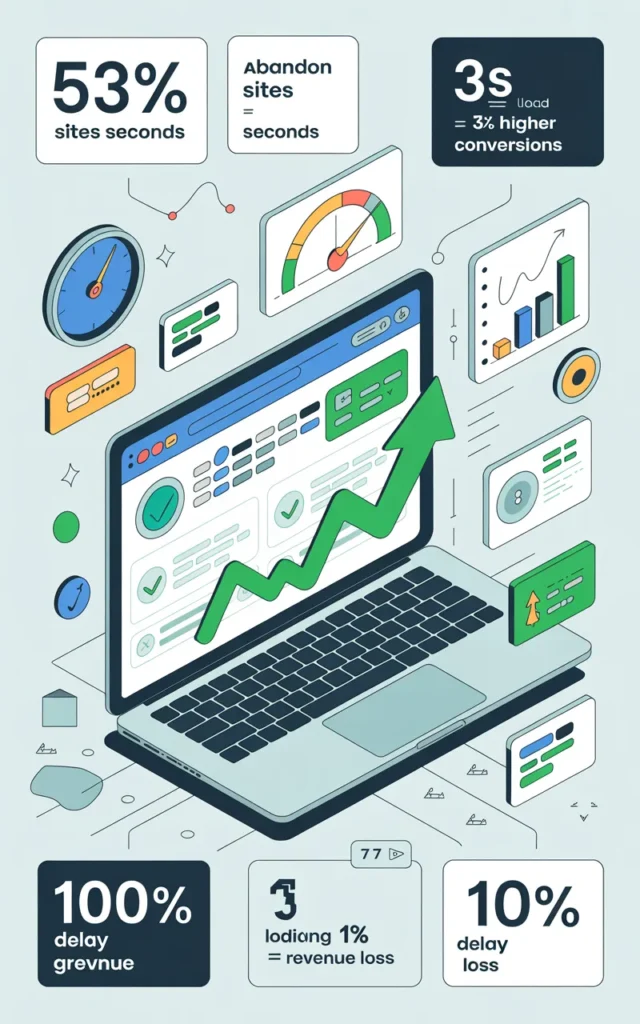
53% of mobile users abandon a site that takes more than 3 seconds to load (Google/SOASTA Research)
A 1-second delay in load time reduces conversions by 7% (Akamai)
Sites loading in 1 second have a 3× higher conversion rate than sites loading in 5 seconds (Portent, 2022)
Amazon found that every 100ms of latency costs approximately 1% in revenue
Pages improving load time from 10s to 1s see up to 70% longer average sessions (Google Developers)
Beyond rankings, page speed is a trust signal. A fast website communicates professionalism and reliability. A slow one does the opposite — regardless of how good your content is.
For businesses in Bangladesh, where the majority of web traffic comes from mobile devices on 4G networks, speed is even more critical. Your audience won’t wait.
How to Check Your Page Load Time
You can’t fix what you don’t measure. Here are the most reliable tools to audit your page speed accurately.
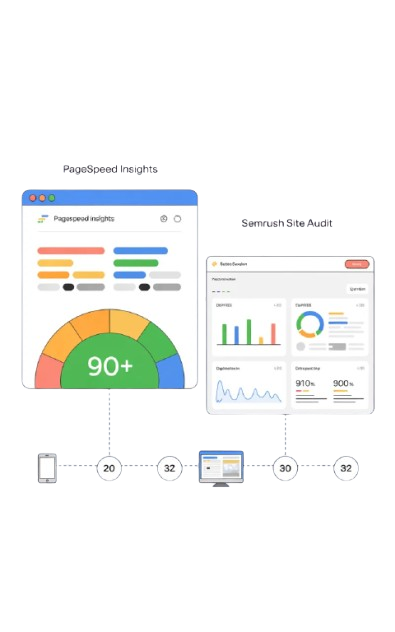
PageSpeed Insights
Google PageSpeed Insights (pagespeed.web.dev) is the starting point for every speed audit. It is free, requires no account, and shows results in seconds.
PageSpeed Insights pulls two types of data:
- Field Data (CrUX): Real-world performance collected from actual Chrome users visiting your site. This is what Google uses for rankings — and what you should prioritize fixing.
- Lab Data (Lighthouse): Simulated page load in a controlled environment. Useful for diagnosing specific issues during development.
The tool provides a score from 0–100 for both mobile and desktop, breaks down your Core Web Vitals, and gives prioritized fix recommendations with estimated time savings. Always run the mobile test first — Google uses mobile-first indexing.
A score of 90+ on mobile is the benchmark for competitive SEO performance.
Semrush Site Audit
Semrush Site Audit gives you a crawl-level view of speed issues across your entire website — not just a single page.
It flags issues like slow page load time, large page size, too many HTTP requests, render-blocking resources, and missing cache policies — and ties them to specific URLs. This is especially powerful for larger sites where performance issues vary page by page.
Combined with PageSpeed Insights, Semrush Site Audit gives you both a macro (site-wide) and micro (page-level) picture of your speed health. Run both. Fix what each one tells you.
Low Speed Is Not Liked by Search Engines!
This is the bottom line, put plainly: slow websites do not rank well. Search engines — Google, Bing, and AI search engines like Perplexity and Google AI Overviews — all favor fast, technically clean pages.
Google’s Page Experience signals include Core Web Vitals as a direct ranking input. But beyond rankings, slow pages are harder to crawl efficiently. Googlebot has a crawl budget — the number of pages it will crawl on your site within a given timeframe. A slow server wastes crawl budget, meaning fewer of your pages get indexed.
For AI search engines, the stakes are even higher. Google AI Overviews, ChatGPT Search, and Perplexity pull content from pages that load fast, are well-structured, and are easily accessible to crawlers. A slow page signals poor user experience — and AI systems are increasingly trained to avoid surfacing poor user experiences.
The conclusion is straightforward: optimize for speed, and you improve your standing with every search engine simultaneously.
Ways to Improve Your Page Speed SEO
These are not generic tips. These are the highest-impact, most widely applicable page speed optimizations — prioritized by real-world impact.
1. Choose the Right Image Format
Images are the single largest contributor to page weight, accounting for roughly 45% of a typical webpage’s total byte size (HTTP Archive, 2024). The format you choose makes a huge difference before you even think about compression.
Use WebP as your default image format. WebP delivers 25–35% smaller file sizes than JPEG at equivalent quality, with full support across all modern browsers. For even better compression with complex graphics, AVIF is the next-generation option — delivering up to 50% smaller files than JPEG — though browser support is still catching up.
Avoid using PNG for photographs (use WebP/JPEG instead). Reserve PNG only for graphics that require transparency. Never serve BMP or TIFF on the web.
2. Compress Your Images
Even in the right format, uncompressed images destroy page speed. A hero image uploaded at 4MB will wreck your LCP score regardless of how well-optimized everything else is.
Use lossy compression for photographs (JPEG/WebP) — users cannot perceive quality differences at 70–85% compression quality. Tools like ShortPixel, Imagify, or Squoosh (free) handle bulk compression effectively.
For WordPress users: install ShortPixel or Imagify to automatically compress and convert new uploads to WebP on the fly. Always compress before uploading — not after.
Target: no image larger than 150–200KB for above-the-fold content, and use loading=”lazy” on all below-the-fold images.
3. Enable Browser Caching
Browser caching tells a visitor’s browser to store static files (images, CSS, JS) locally after the first visit. On their next visit, those files load from local storage instead of your server — making repeat visits dramatically faster.
Without caching, every page visit forces a full re-download of all assets. With caching, most assets are served instantly.
Set cache-control headers with appropriate expiry times — typically 1 year for static assets (images, fonts, JS) and shorter durations for frequently updated files. On WordPress, plugins like LiteSpeed Cache or WP Rocket handle this automatically.
4. Minify JavaScript, CSS, and HTML
Minification removes unnecessary characters from your code — whitespace, comments, line breaks — without changing how it functions. This reduces file sizes and speeds up delivery.
A typical website can reduce its CSS and JS file sizes by 10–30% through minification alone. Combined with Gzip or Brotli compression (enabled server-side), you can cut total transfer sizes significantly.
Use tools like Terser (JS), CSSNano (CSS), or automated bundlers like Webpack. On WordPress, LiteSpeed Cache, WP Rocket, or W3 Total Cache handle minification with a single toggle.
One critical step: defer non-critical JavaScript. Add defer or async attributes to script tags that are not required for initial render. This prevents JavaScript from blocking the browser from rendering your page.
5. Use a Content Delivery Network
A CDN (Content Delivery Network) stores cached copies of your static assets on servers distributed globally. When a user visits your site, assets are delivered from the nearest edge server — not your origin server.
For a website hosted in Singapore but visited from Dhaka, Chittagong, or Sylhet, a CDN like Cloudflare can cut load times by 40–70% by serving files from a nearby edge location rather than routing the request across continents.
Cloudflare’s free tier is sufficient for most small to medium websites. It adds a WAF, DDoS protection, and automatic HTTPS on top of the CDN benefits. For higher-traffic sites, BunnyCDN or AWS CloudFront offer more granular control.
A CDN also reduces load on your origin server, improving TTFB and overall stability under traffic spikes.
6. Improve Your Server Response Time
TTFB — Time to First Byte — is the time between a browser sending a request and receiving the first byte of data from your server. Google’s recommended TTFB is under 800ms. Poor TTFB is often the root cause of bad LCP scores.
Common causes of slow TTFB:
- Shared hosting with overloaded resources
- No server-side caching (every request rebuilds the page dynamically)
- Heavy database queries or unoptimized PHP/backend code
- Geographic distance between server and user
Fixes: upgrade to SSD-based hosting or a VPS, implement server-level caching (Redis, Varnish, or LiteSpeed’s built-in cache), use a CDN to handle static assets, and consider a server location closer to your primary audience. For Bangladesh-based sites, Singapore or India-based servers typically offer the best TTFB.
7. Reduce Redirects
Every redirect adds a full HTTP round-trip to your page load. A chain of 3–4 redirects before the final URL can add 300–500ms to your load time — and that’s before any content starts loading.
Common redirect problems:
- http:// → https:// → https://www. (two redirects when one would do)
- Old pages redirecting through multiple legacy URLs before reaching the current one
- Mobile redirect chains (m.site.com patterns)
Audit all redirect chains in Screaming Frog (Spider → Response Codes → 3xx). Flatten every chain to a single direct redirect. Make sure your canonical URL resolves in one hop.
8. Reduce HTTP Requests
Every element on your page — images, scripts, stylesheets, fonts, icons — generates a separate HTTP request. The more requests, the longer the loading process.
According to HTTP Archive (2024), the median webpage makes over 70 HTTP requests. Each one adds latency, especially on mobile connections.
Reduce requests by:
- Combining CSS files into one stylesheet (or use Critical CSS inline + defer the rest)
- Removing unused plugins and scripts — especially on WordPress
- Using CSS icons or an icon font instead of individual icon images
- Inlining small SVGs directly in HTML rather than loading them as separate files
- Eliminating third-party scripts you no longer actively use (old chat widgets, abandoned analytics tags, forgotten pixels)
Run a waterfall analysis in GTmetrix or WebPageTest to identify which requests are slowest and most worth eliminating.